Elements On The Channel Status Tab
OMNIBOX.exe is interfaceless, it is a collection of working threads that will do all telephony related tasks. Any GUI would add unnecessary overhead to its job. To monitor and control OMNIBOX is what you have OmniMonitor for. OMNIBOX will broadcast its status using UDP (User Datagram Protocol) Sockets. OmniMonitor will receive these packets and display graphically this information. OmniMonitor will also send commands to OMNIBOX also using UDP messages. Acknowledgement of such commands will flash green or red in the Ack label indicator. CDR replication activity will also flash in green in the Replic indicator when successful and in red if not for any reason.
OmniMonitor can receive directly the broadcast from OMNIBOX or from the UDPRelay application. This is part of the OMNIBOX suite, it receives the broadcast from OMNIBOX and accepts TCP connections from remote sites through the Internet (or private IP network). OMNIBOX also sends a copy of all the messages it Broadcasts to a database specified IP address. There a UDPRelay can receive it an rebroadcast it in its local area network also accept remote TCP connections.
OmniMonitor was designed to use TCP as well as UDP, but the use of this later protocol have become obsolete. This may be specified through the Monitor.ini file (See Appendix B). To show the mode it is set, a TCP indicator shows up when in this mode, it will light in green when a connection is established and turn red if closed.
The Monitor has also a scheduler feature that can be setup with the Monitor.ini (See Appendix B for details)
The monitor requires a screen resolution of at least 800x600, but 1024x768 is recommended.
This is important to understand how the application in the OMNIBOX suite talk to each other and also what is the meaning of the socket related parameters in the sys_Parameters table.
 The
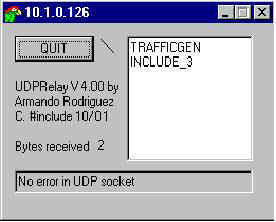
UDPRelay or the Parrot, as it has got be known, is a program that will receive
the UDP packets from OmniBox (see the 'Bytes received' counter) and then
through a TCP listen socket, it will send a copy of every packet received to
each of the connected OmniMonitors . It will also send a copy to a specific UDP
port This port is meant to be used by a second UDPRelay and so, a chain of UDP
relay’s may be implemented.
The
UDPRelay or the Parrot, as it has got be known, is a program that will receive
the UDP packets from OmniBox (see the 'Bytes received' counter) and then
through a TCP listen socket, it will send a copy of every packet received to
each of the connected OmniMonitors . It will also send a copy to a specific UDP
port This port is meant to be used by a second UDPRelay and so, a chain of UDP
relay’s may be implemented.
A text box, on the UDPRelay window, shows a list with the names of the computers where the connected OmniMonitors reside. There is a security feature that can limit access as well as monitoring and administrative privileges to a specified set of computers (See Appendix B). For any version higher than 3.38, to the right of the Quit button, there is a rotating line that indicates activity in the main thread which means that the sockets performance are being watched. In the event of socket corruption it will self unload the program. There’s this joke that, we have a suicidal parrot here! Because of this suicidal nature, its loading is done through a recurrent batch (the UDPRelay.bat), one that executes the UDPRelay.exe command line and then, it executes its self.
Sys_Parameters Table:
|
Set_ID |
ParamID |
ParamNumValue |
ParamStringValue |
Description |
|
0 |
3 |
1005 |
|
Engine
local socket port number |
|
0 |
4 |
1006 |
0 |
Monitor
socket port number |
|
0 |
5 |
xxxx |
1.1.1.111 |
Remote
Monitor IP |
The
UDPRelay command line:
OMNIBOX port
Monitor
TCP listen UDP Mon port
OMNIBOX IP
UDP
Relay 1
1006,
1005,
1066,
1065,
10.10.10.136
UDP
Relay 2
1005,
1065,
1067,
1068,
1.1.1.111
The ini file for UDPRelay 1 must include a line:
NEXT_RELAY_IP, “2.2.2.222”
Ini file for OmniMonitors connected to UDPRelay 1
ENG_LOC_PORT,
1066
ENG_LOC_IP, "1.1.1.111"
Ini file for OmniMonitors connected to UDPRelay 2
ENG_LOC_PORT,
1067
ENG_LOC_IP, "2.2.2.222"
When ever the use a UDPRelay.ini is needed, the path to the file after the OmniBox IP must be added to the UDPRelay command line separated by a comma.
To avoid crowding the OmniMonitor window area with too much information, Data is organized in two different Tabs. The first tab, Channel Status, is the one that will be used the most, it gives the general picture of the traffic situation at a glance. If you are watching for an alarm situation, then the Alarms tabs is the one to watch.
This tab will show the collection of status cells and a text box where call information of a selected channel is displayed.
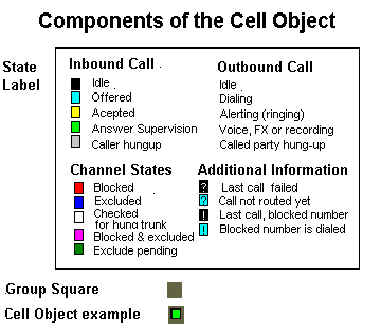
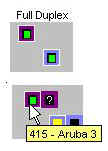
Each channel in the Tab is represented by a Cell object. Each Cell object has a Group square and a State label..
The
Group square color indicates a
particular group ID, al the channels belonging to a group will have the same
color in the Group square.
The state of a call and the channel state are represented by the State label. The code for the background color of the State label is shown in the figure at the left of this text
The State gives also additional valuable information, it shows a ‘?’ until the call connects, so when it doesn’t, it keeps the question mark after the call is finished. This way a failure is highlighted even after the call is ended. Many ?’s can be a cause for concern. If a number is blocked, a ‘!’ will show instead, highlighting other usual source of trouble. Below, an example of the state sequence a completed call is shown. Notice that the alerting state is further highlighted by a line between the routed channels.
 If
you are interested checking a particular
route, you may move the mouse over the
a Channel cell, the Group square
border will turn White in both inbound and outbound cells, also if the
"Show Route Lines" menu option is checked, a line will show
joining both cells .
If
you are interested checking a particular
route, you may move the mouse over the
a Channel cell, the Group square
border will turn White in both inbound and outbound cells, also if the
"Show Route Lines" menu option is checked, a line will show
joining both cells .
Also when you stop the mouse cursor over a Cell, the Tip Text will show the channel number, the name and number of the Group it belongs to in the format:
Ch#
- GroupName Group#.
A channel is marked by clicking on its States square. You can tell a channel is marked because an X shows in State label. You can mark a group of channels the same way you select icons in your desktop, pushing the left button of the mouse and dragging the corner of the dotted line rectangle that shows up around the group of cells that you want to mark. The buttons Exclude and Include act only upon marked channels.
The rightmost labels will bear the name of the inbound group the span belongs to and the span number while the labels at the right of the cell objects will show the Span number and the Outbound group if it belongs to one. If a span is shared by more than one group, their names will show separated by dashes in the same left to right order as they appear in the span. These labels will be referred to as Group Labels hereafter. The text in group labels of shared spans may not fit inside the it, if this is the case you may select a smaller font for your labels with the Label Font Menu Item under View.
A Group Label with the background in red, like T1 number 3 in the picture above, will mean that it is the Master Clock of OmniBox. If that T were to show as blocked for being out of sync, it would imply that the box has no master clock and that it is most likely that its frequency is drifting causing Clock Slips. The T with the master clock must always show synch.
If there is no Group Label in red but you haven’t upgraded to Dialogic Release 5.1, it means that it is set to Automatic which defaults to the first T1 of the first board in the DCM (Dialogic Configuration Manager) list. If you are under 5.1, then just refresh info and it will show.
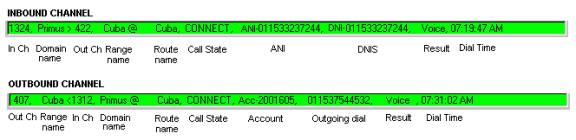
There are two text boxes at the bottom of the tab area, the top one is the Call Detail Text Box and the bottom one the Last Alarm Text Box.
![]()
The top one will show the call detail information of the channel that the mouse is hovering over. The background color will match that of the State Label. The information will update as the call progresses automatically. If the call finishes, the information will still be shown with black background, its result and a NULL state. This way, you may see what happened with the last call in a channel even when is over. When the mouse cursor is away from the cell area, the textbox will show the call detail to the channel with the most recent state change in the OmniBox. You may open the Call Detail Window to see call details for a whole span. The content of the call detail is different for inbound and outbound channels:
The bottom text box shows the last alarm received in a red font (you can’t miss it). You may see, not only the last but all the alarms by clicking on the Alarms tab.
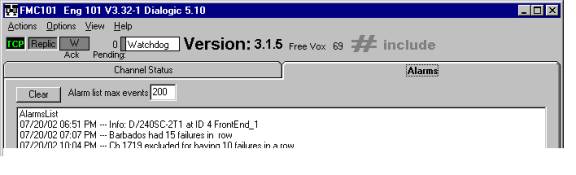
OMNIBOX will issue alarms not only on firmware events like T1 sync loss but, also on traffic abnormal situations. Alarms will be made into sentences and then sent to the OmniMonitor where they are displayed together with the arrival time. Alarm messages preceded by the word “Info”, are not alarms at all, they are information messages, like the first one in the example above that states which physical span is set to be the master clock. Text in the alarm list can be selected with the mouse, copied into the clipboard and pasted elsewhere for documentation purposes. Also (for V3+) these alarm messages can be e-mailed to a list of recipients and can act as pages, becoming a new modality of Watchdog.. Some alarms are::
· T1/E1 alarms
· Low completion rate in a range.
· Test pager message
· Too many non routable call for a client.
· Too many bad calls in a row for a range
· Too many bad calls in a row for a channel and if it was excluded.
· Too many short calls for a client (indicate possible wrong numbers etc.)
· Low traffic for a client (Client lowered priority for your route or disconnected traffic)
· System unloaded
· Replication failure.
· Events that go to the NT log are also displayed in OmniMonitor. (Short of voice resources, changes to database committed, firmware related problem etc.)
· Actions
· Commit DB Changes
· Sys parameters only
· Commit All DB Changes
· Hung Trunk detector.
· Kill LapLink
· Unload App
· Options
· Test Watchdog page
· Record Log File
· Play Log File
· E-mail Page
· Enable Pager
· E-mail addresses
· Alarm masks pages and sounds
· Page Number Mask
· Page String Mask
· Page String Allow
· Allow Sounds
· Make ini file with current settings
· View
· Refresh info
· Reconnect
· Call Detail Window
· Stats Window
· Message Broadcast Window
· Group Colors
· No Color
· Group Color 1
· Group Color 2
· Group Color 3
· Show Route Lines (See "Checking a particular route" above)
· Label Fonts
· Font Narrow
· Bold
· Size
· 8
· 9
· 10
· 11
· 12
OMNIBOX is a database driven application, some parameters are read from the database at load time, when any of these parameters are changed, they won’t take effect until the Commit DB Changes command is issued. If the command is performed successfully, this meaning that the new data was consistent, the Ack indicator will flash an “I” twice with a green background, also an alarm sentence with event number 38999 will be issued.
Data from the routing (RouteTable, IdxLookup, Tec_BlockList...) and administrative tables (Balance, AuthorizationCodes, LegBRateLookup...), are read from the database on every call and so, changes take effect immediately, in other words, they don't have to be "committed".
Data in tables sys_Parameters and dia_Tones, are read upon loading of the OmniBox, for any changes to these tables to take effect, it is necessary to instruct the application to read this tables again, and this is done by hitting Actions/Commit DB changes/Sys Param only. This action also resets the Internet Socket to accept a port number change. The action is similar to the one triggered by hitting the Reset Socket button on the OmniBox window, except that the button always resets the socket, even if the port number has not been changed, this is provided in case you need to recover from a corrupted socket. Changes to memory management related parameters in sys_Parameters, namely those that define the application's working set, as well as Max Domains and Max Ranges, won't take effect until the application is reloaded
Changes to state machines and/or its command sequences also require a commit command to take effect, Actions/Commit DB changes/State Machines only. To avoid crashing, there must be no ongoing calls using custom state machines, so traffic must must be stopped prior to issuing the commit command.
For changes to CDP files, to tables dia_InCh, dia_OutCh or dia_GroupDefs to take effect, the Actions/Commit DB changes/Commit All DB changes must be issued. Except for changes to dia_GroupDefs this changes can be executed on the fly, meaning without draining the the traffic involved trunk groups. But if there are channels that will change its trunk group, calls must be drained from all the involved trunk groups before hitting the command. If you don't, you will get a warning message and group definition changes won't go into effect (parameter changes, will take effect).
07/03/01 07:23 PM ---Event 1000: No GroupDef changes to Range 2, 5 channels in use
Normal behavior will show something like this:
05/26/03 08:16 AM --- Event 38999 : Commit DB changes received I7
05/26/03 08:16 AM --- Info: RegisterTones
05/26/03 08:16 AM --- Info: Check for CDP file changes
05/26/03 08:16 AM --- Info: Init Outbound
05/26/03 08:16 AM --- Info: init Inbound
05/26/03 08:16 AM --- Event 38999 : DbChanges In effect, Def changes in 23 Ch,
Inconsist: 0 ch, cdp affected: 0 ch
In this case there were definition changes (channels changing its trunk groups) affecting 23 channels, no inconsistencies were found and there were no channels affected by changes to cdp files.
Hung Trunk Detector
OmniBox has feature that goes analyzing channels in use for silence, busies, rings or SIT tones to determine if the use is legitimate or just a hung trunk. This action enable/disable the feature for service purposes. (See Chapter 7). There are only two circumstances in which OmniBox terminates a connected call:
The call is lasting beyond the maximum specified length in the sys_parameter table;
The
hung trunk detector has concluded that a call is actually a hung trunk. In
theses cases calls are logged and showed on the monitor as such, with a result
code > 1000 meaning that they had been terminated by OmniBox
Cases
where clients or providers complaint that calls are being cut by OmniBox are
frequent. In such an event you may use this menu item to stop the only possible
cause, the hung trunk detector, as to eliminate OmniBox from the suspects list
(has never been found guilty).
NOTE!: Under robbed bit protocol, clock slips can cause calls to be terminated for signaling bits can go hi-low during such events. These cases are logged as terminating normally. Clock slips also show other symptoms, they generate bogus seizures that show in the monitor as calls with no digits
.
LapLink is one of the components of the OMNIBOX suite, it allow to remotely control its host computer. In old versions of LapLink, it happened rather frequent that it froze, not allowing a remote control or file transfer session. OMNIBOX can be set to periodically reset LapLink, this is kill the LapLink App. and let the KeepAppUp (other member of the suite) program restore it, but the period is generally 2 hours or more and if you need to connect right away you may not want to wait. Since generally there is a network connection to this host computer, you may use this command to reset the LapLink. Recent versions, LapLink 2000 or LapLink Gold, require no longer the use of this feature.
Most of the changes in the database can be committed without resetting the OMNIBOX app. but still some remain, namely: voice resource total count or distribution in types; some protocol changes, some board configuration parameters; master clock reference; changes in total channel count. These cannot be changed without resetting the app. and in some cases, resetting the Dialogic service is necessary as well.. Also if there is a new version already loaded into the release directory that need to be put in effect, then OMNIBOX must be unloaded and the KeepAppUp will bring it back in a process that would take no more than a minute.
It is quite common that you need to test the pagers to be used by the Watchdog system. You can’t just sit around and wait for an alarm to happen. On earlier product you had to pull a T1 out to trigger an alarm or hit Commit DB Changes with no real change just to generate a page. With OMNIBOX, you just hit Test Watchdog Page, and a special message, 2*Eng, will be sent just for test purposes.
Sometimes
events happen so fast that is difficult to catch up with them, also sometimes
things happen that you want somebody else to see at a later time. What
OmniMonitor does, is to display in a graphical way the contents of the status
messages sent in IP socket packets from the OMNIBOX main app. When you select
this command, all the socket messages will be saved into the Monitor.Log
file together with the time (in milliseconds) since
the beginning of the recording at which the message occurred. The moment you hit
the command, it will display a check mark and a label with 'Recording'
in red will start blinking, to stop recording hit the command again, the process
will stop and the check mark will disappear and so the blinking label. This file
can then be sent elsewhere and played back (see Play
Log File), this meaning that OmniMonitor will display the same as when
recorded.
Monitor.Log
is a text file that can be read and interpreted directly with the help of the
protocol description in
Appendix A.
Will close the socket and read events from Monitor.Log at the specified moment and behave as if it was received in an IP socket packet. The command will be displayed as “checked” during playback; you may stop playing by hitting the command again.
Taking
advantage of the every day more popular e-mail feature in pagers and cellular
phones, starting with OmniMonitor V3.00, a new Watchdog concept was introduced
into the OmniBox system, Now, any instance of OmniMonitor can be a Watchdog
that, by using the underlying Internet Mail installation, can page a list of
recipients.. Sending, not only a numeric message like in the original Watchdog,
but the whole alarm message.
The
email pages can be enabled/disabled by checking/un-checking the Enable Pager
menu item. When
you enable the email paging service, you will be prompted for the recipient list
with and input box. There you can enter the recipient list separated by
semicolons, the same way you do with any email message. Any previously entered
list will be shown as default
e-mail addresses
Once enabled the e-mail paging system you may enter additional addresses or edit the existing ones with this item.
For
the system to be useful, it must provide a means of filtering the messages to
produce a sound or to be e-mailed. Also even after filtering, e-mails will be, al least, ten minutes
apart and will contain all the filtered messages in those ten minutes.
It
supports the legacy number mask of the original Watchdog, were alarms were
classified into types:
Type |
Description |
Num
Message |
Parameters |
|
0 |
T1
alarm |
0*B*C*E |
B=
Board Number; C = Alarm code; E
= WD Engine ID(for all messages) |
|
1 |
Low
Completion Rate |
1*Cr*E |
Cr
= Complerion Rate % |
|
2 |
Test
page |
2*E |
Ch
= Channel Number |
|
3 |
NT
event Log had an entry |
3*Ev*E |
Ev
= Event ID |
|
4 |
OmniBox
is dead |
4*E |
|
|
5 |
Too
many bad calls in outbound Ch. |
5*Ch*E |
Ch
= Channel Number |
|
6 |
To
many bad calls in an outbound range |
6*Rng*E |
Rng=Range
ID |
|
7 |
Too
many short calls |
7*Sh |
Sh
= % rate of how many of the good calls are short |
|
8 |
Low
traffic |
8*Exp*E |
Exp
= Expected seconds to the next call. |
|
9 |
System
unloaded |
9*E |
|
|
10 |
Exception
in the Watchdog app |
10*Asc |
Asc
= ASCII code for alarm ID that cause the exception |
|
11 |
Too
many non routed Calls |
11*D*E |
D
= Domain ID |
|
12 |
More
than 20 replication failures |
12*E |
|
|
13 |
Seized
more than 3 times being excluded |
13*Ch*E |
Ch=Inbound
Ch |
|
14 |
UDP relay not responding |
|
OmniMonitor Watchdog only |
The
system allowed to mask some page types by specifying its numbers in an ‘*’
separated string like:
1*3*5*13
If
you hit the submenu item Page Number Mask, you may enter the same
string into the input box prompt.
This
new system allows for even further control. If you select an identifying
substring within an alarm message that you choose not to receive as a page even
if the type is not masked by number. You may enter it as a page string mask. You
may enter any number of String masks separated by semicolons. Example:
Ecuador;Guate
Page
type 6 is not masked, yet, a 6 page involving Ecuador or Guatemala will be
masked The masking system is case sensitive and spaces are regarded as valid
characters.
You
may also select an identifying sub string within an alarm message that you choose
to receive as a page even if the type is masked by number. Syntax is the same as
with the Page String Mask. Example:
Exception;20%
Even though Completion rate pages (#1) and Event pages (#3) are masked, event alarm messages containing the word ‘Exception’ or Completion rate alarm messaged containing the figure 20% will make it to a page.
There
are special sounds for Log Event alarms (sounds like rescue or police car) and
also there are when a chat message is received (sounds like a ring). This sounds
may be enabled/disabled from the by checking/unchecking this menu item. These
sounds are disabled by default, but you may change this adding a special PLAY
SOUND, 1 line in the ini file.
Any
settings done during a session will be “forgotten” by the system when you
unload OmniMonitor. The only way to make them permanent, is to include a line
into the ini file that turn them into defaults. Ini files are not the
friendliest interface though, but V3+ has got this feature that allows you to
make the current settings permanent by hitting the above menu item. The right
lines will be introduced into or removed from the ini file. Also once this is
done for you, the resulting ini file will be showed in a Notepad session. The
new ini file will take the same name it had and the old ini file will be saved
as filename.ini.old.
Refresh Info
Since there is no guarantee of integrity when using UDP, it may happen that socket messages are lost in the IP cloud, leaving some cells in an inconsistent states. If this happens, you hit Refresh Info, and the real status will replace the suspicious one.
Reconnect
On connection over the WEB, sometimes commands may no reach OmniBox, if this were to happen, you me hit ‘ReConnect’ to close and reopen the socket. Normally control is back after this.
Sometime when you are chasing an specific call or you need to se how a T is doing all at once, maybe in combination with the 'last call in a span feature' of the Analog Service Line, it becomes handy to see the call detail text boxes of a whole span.
You may scroll through the spans using the control on your left.
This window supports the feature that allows broadcasting messages to the rest of the monitors currently connected.
Useful information on every oubound Range, like the group number, the number of calls being processed and the calls per minute that are being setup, is shown on this window. The information is shown in textboxes, one per range in the following format:
G
XX- NNc, MMcpm
Where: XX is the Group number,
NN the number of calls and
MM the nunber of calls per minute.
The vertical position of the textboxes containing this information matches that of the last span in the range on the Channel Status Tab, as shown in figure above. If more than one range share a single span, the corresponding text boxes will appear in the same order on the same row.
It is useful to have a reference to the Group number when browsing through the CDR’s or interpreting the Watchdog numeric pages. For example if you receive a 6*16*13 page, it would mean that range 16 in Engine 13 has had more than the specified failures in a row for that range. Displaying the stats window for the Engine 16 monitor will show that range 16 is Ecuador 3.
Since Group colors are assigned automatically by the monitor according to the Group ID, sometimes ID numbers are such that the contrast between adjacent groups do not show enough. This may also happen between a Group and State Colors. To solve this, three sets of color are provided. You may try them all and make the one that suits best you system the default by hitting the Make ini file with current settings menu item.
This menu item will allow you to select the font size and weight for the Group Labels. For the Font size, you may choose a Narrow font type (Arial Narrow) or a wider one (Arial). Also, within the selected type, there are 5 choices of size from 8 to 12. If your system has single short names per span and you are using high resolution for your screen, you might want to use the Arial Font, Bold and size 12, if on the contrary, you have shared spans and/or long names, then you may have to use Arial Narrow, regular weight and size 8. The default settings are Arial (not narrow), Bold and 10. The defaults may be changed using the SET_FONT line in the ini file (see Appendix B).
The Excluded state, is that one in which a channel is disabled but different than the Blocked state in that is there is nothing physically wrong with it, it is just an administrative decision to exclude that channel from being selected as an outbound channel or disabling its ability to respond to a call by bringing it out of service.
To exclude a channel from a Monitor, you must first mark it and then hit the Exclude button. There are two ways of excluding a channels when calls are involved, this is with and without call truncation. If the Truncate check box is checked, any calls associated with the marked channels will be terminated and the channels will show Blue immediately; but if not checked, it will turn from Green to Cyan meaning that exclusion is pending and when the call finished it won't go to Idle call state, but to Excluded channel state . This last excluding mode is good when you need to "drain" a trunk group.
To include back an Excluded channel, you must mark it and hit the Include button. To remove the marks (X), you may toggle them by the same procedure use to mark them, this is by click on each and but dragging a rectangle around them. Also if you need to get rid of all the marks, the button Unmark All can save you the time of going around unmarking all the marked channels.
The button Stats will render the number of call connected and in progress in the Call Information text box.
The digital clock in the right most text box shows the local time at the OmniBox. It is refreshed every ten seconds. The time shown in the Call Information box and in the Call Detail Window is OmniBox time which may be off a few minutes to the one in computer running the monitor. Having the OmniBox time, the length of any given call may be estimated down to the seconds range. Also, this clock stopping can highlight a break in the IP connection.
*Note: When dealing with CCS protocols like ISDN or SS7, the exclusion of an inbound channel involves an OUT_OF_SERVICE_REQUEST message to the network that, if granted, will in also produce a BLOCKED event, in which case an excluded inbound channel (in blue) will also show as blocked (blue + red=magenta).
The elements in the Alarms tab are the event list and the ones that have to do with the clearing of these events. If there where no limit to the size of the list, it could grow indefinitely to the Virtual Memory crisis message, that's why, after V3.0.9 this limit was provided. Its default value can be set in the ini file with the MAX_ALARMS command if not defined it will default to 200 but can be changed at run time by entering a new value in the Alarm list max events textbox. If the entered number is less that the row count of the list, the earliest outstanding rows will show as selected (in dark blue background). I you hit the Clear button or the delete key, the selected rows will be deleted. To discard useless events, you may select and delete any rows you want from the list. Every time the list attempts grows beyond the maximum specified, the first row will be deleted.
Every message from the OmniBox is preceded by a trunk group prefix, that is separated from the message by a "!" sign. the format goes:
ddrr!<Msg>
Were dd is a number from 01 to 99 indicating the inbound trunk group (Domain) or 00 to indicate that the message does not reference any; rr is a number from 01 to 99 indicating the outbound trunk group (Range) that the message references o 00 meaning that no Range is referenced in the message. This prefix play a roll when the information to be sent to an OmniMonitor must be filtered. In other words, for example, you may allow a client to watch its traffic but not the traffic or any other information regarding other clients.
Status Broadcast:
The
t message
t ChNum, GroupID, State, RouteChNum
The t broadcast is issued any time a channel changes its state or if a refresh is requested from OmniMonitor. ChNum is the channels number. It is formed in the following way:
ChNum = (Span Number)x100 + TimeSlot Number
For example the 4th channel in the third T1 would be 304.
State
|
State |
Inbound |
Outbound |
Channel |
|
0 |
Idle |
Idle |
- |
|
1 |
- |
- |
Blocked |
|
2 |
Connect |
Connect |
- |
|
3 |
Accepted |
Alerting |
- |
|
4 |
- |
- |
Excluded |
|
5 |
Disconnected |
Disconnected |
Blocked
+ Excluded |
|
6 |
Offered |
Dialing |
Excluded
while in use |
|
7 |
- |
- |
Analyzed for Hung Trunk |
NOTE: In ISDN spans, when you exclude a channel, it is acknowledged by the network by blocking it from its side, so a channel properly excluded will show in Magenta (State 5) not in Blue (State 4) as with robbed bit protocols.
RouteChNumber = 0 if not routed to any other channel, if routed then the Ch number to which it is routed to using the same numbering criteria as ChNum.
The c message
cChNum,Call status description string
ChNum: same criteria as with the t message.
Call status description string:
InCh
InGroup > OutCh OutGroup Route, State Str1, Str2, Result, ISDN release cause
Where
Str1: The received dialed string, but if it is the same as the outbound, then it will carry the ANI and if there's no ANI then the Account Number
Str2: The string dialed into the outbound channel.
In case of IVR funcions, while login takes place, the Str1 will show the DNIS and Str2 the ANI.
The A message
A <alarm or Info message>
The A stands for Alarms, a messages go directly to the alarm tab event list preceded by the computer's date an time. These messages can trigger pages to different operators when content matches or doesn't certain mask specifications.
All the commands from the Monitor to the OmniBox are structured as five characters terminated with a pipe '|'. For instance the inquiry command S, see below,. should be SSSSS| and an action command like exclude channel 1023 should be issued as X1023|.
The monitor has 4 inquiry commands, the S, D, U, C.
S command stands for System. The response will be:
S Engine Number, OmniBox version, Dialogic Release, Max Domain ID, Max range ID
D command request the Clients and Range names. The response is a series of D responses, one for each trunk group, like the following:
D groupID, [0 for Domain or 1 For Range], Group Name
U command stands for update will request a re-send of the status for all channels, so the response is a series of t messages, one per channel.
t ChNum, GroupID, State, RouteChNum
C commands request for Master Clock span, response:
+CBoardNum
and
also an info message to the alarm Tab:
A Info: [master clock Board name] at [ID] [span
name]
It
will show in the alarm list as something like:
Info:
DTI/480SC at ID 2 FrontEnd_1
I – Commit DB changes
p – Page test
L – Kill LapLink
Q – Unload Omnibox
X[Ch] – Exclude Channel
x[Ch] – Include Channel
t[Ch] -- Blast Channel
T[Ch] -- Stop Blast on Channel
Responses to these commands are +(command letter) for acknowledge or –(command letter) for not acknowledge. For example, +I would means successful database changes or –I is some inconsistency is found.
Monitor.ini file. Example (The order is immaterial)
TCP, 0|
ENG_LOC_PORT, 1006
ENG_LOC_IP, "10.1.0.127"
MON_PORT, 1005
TITLE, “COMPANY_1”
PLAY_SOUND, 1
DELTA_Y, 2.5
WD_PROGRESS, 0
LOGO_PATH, "CompanyLogo.bmp"
CHK_UDP, "10.1.0.127"
SCHED_CMD, "??/??/?? 23:00:00 - X0101|X0102"
SET_FONT, “N1 B1 S9”
MAIL_PAGEES,
"2548312261@airmessage.net; msan@bellsouth.net"
MAIL_MASK, "*0*1*5*13*"
MAIL_STR_MASK, "Ecua;Guate"
MAIL_STR_ALLOW, "Exception,20%"
MAX_ALARMS, 100
Description of the lines
TCP this line will for TCP mode.
ENG_LOC_PORT is OMNIBOX port number or that of the UDPRelay
ENG_LOCAL_IP is OMNIBOX IP Address or that of the UDPRelay
MON_PORT OmniMonitor’s port number, not needed if TCP mode is selected
TITLE is the text that will appear on the Windows caption.
PLAY_SOUND There are special sounds for Log Event alarms (sounds like rescue or police car) and also when a chat message is received (sounds like a ring). This sounds may be enabled/disabled from the View menu but they can also be enabled by default with this line in the ini file, otherwise the default will be 'disabled'.
DELTA_Y is the row separation expressed in Cell sizes.
WD_PROGRESS, if this line is present the Watchdog progress indicator will show, in this option is not in use you can choose not to show it.
LOGO_PATH Path to a bitmap that will show on the window's top right.
CHK_UDP Will enable the feature that watches the UDP relay and terminates in case of no response, after the comma, the IP of the corresponding Engine must be entered.
SCHED_CMD , "[date time]-[Action commands separated by '|'] This line will schedule the Actions Commands (see Appendix A) to be sent at the time specified in [date time]. You may use the wild card '?', to make a command repetitive. The wild card will be replaced by the number that corresponds to current time, the line in the example will execute every night at 11PM. You can include up to 10 these SCHED_CMD lines.
SET_FONT, “N1 B1 S9” Sets Group Label default font to N (Arial Narrow-1/Arial-0), B (Bold-1/Regular-0) and S (your choice of size from 8 to 12). Any separator, space, comma or even nothing is acceptable. For example, N1B1S9 or N1-B 1- S9 or N 1, B 1, S 9. But something like N-1 B,2 S_9.will not be.
MAIL_PAGEES, "2548312261@airmessage.net; msan@bellsouth.net" List of recipients for e-mail pages
MAIL_MASK, "*0*1*5*13*" Old watchdog legacy number mask as explained above.
MAIL_STR_MASK, "Ecua;Guate" String mask, if any of the semicolon
separated strings finds a match in an alarm message it won't be sent as a page.
MAIL_STR_ALLOW, "Exception,20%" String mask, if any of the semicolon separated strings finds a match in an alarm message it will be sent as a page even if its number type is masked..
MAX_ALARMS, 100 Maximum size of the alarms list to 100 rows.
Security
features parameters (V4.00 or greater) are specified via the
UDPRelay.ini file. The path to this file must be added to the UDPRelay command
line after the OmniBox IP separated by a comma. This ini file can limit the
computers that can open an OmniMonitor to an (ACCESS_LIST), it can also specify
who is allowed to
issue control commands in the (ADMIN_LIST). You may even limit the Inbound
Domains or outbound Ranges that may be monitored by a given OmniMonitor. The
Format of this file is as follows:
ACCESS_LIST,
“[Computer name list]”
[Computer
name list] are the names of the computers that will the have rights to open a
connection separated by a space. When this line exists, only the monitors
running in computers with their network names in the list are allowed to connect
The list may take as many lines as needed. If the selective monitoring feature
is going to be used, a SelectID number must be added to the computer name as a
prefix, no spaces, dashes or slashes.
Example:
ACCESS_LIST,
“0DOMAIN1 1STATION3 2REPORT_SYS”
ADMIN_LIST,
“[Computer name list]”
[Computer
name list] are the names of the computers that will the have rights to open a
connection separated by a space. If
this line does not exists every monitors will enjoy administrative privileges.
The list may take as many lines as needed. No need for a SelectID here.
Example:
ADMIN_LIST,
“DOMAIN1 REPORT_SYS”
MAX_TYPES,
[number greater than Max ID used +1]
This
command reserves memory for the selective monitoring feature. If you have, say, 3
computers in the access list, like
in the example above, you probably want to use 0, 1 and 2 as SelectID’s. In
this case you need at least a 4., but 5,8 and 20 would also be OK
Example:
MAX_TYPES,
4
SEL_MON_R,
“[SelectID]-[Two digits RangeID List separated by spaces]”
SelectID
is the number prefixed to the computer name in the access list. The outbound
range ID list, is the set of allowed Ranges for monitoring, expressed in two
digits (01, 02, 03…99) and separated by simple spaces. The whole string must
be inside quotes. One line per SelectID with limited monitoring rights. You may
simply omit a Select ID line to grant full monitoring rights for outbound
Ranges.
Example
SEL_MON_R,
“0-01 05 07”
SEL_MON_R,
“1-01 03 09”
The OmniMonitor in the DOMAIN1 computer will be allowed to monitor ranges 1, 5 and 7, the one in STATION3 may monitor ranges 1, 3 and 9, the one in REPORT_SYS have full rights for ranges because is not listed.
SEL_MON_D,
“[SelectID]-[Two digits DomainID List separated by spaces]”
SelectID
id the number prefixed to the computer name in the access list. The inbound
Domain ID list, is the set of allowed Domains for monitoring, expressed in two
digits (01, 02, 03…99) and separated by simple spaces. The whole string must
be inside quotes. One line per SelectID with limited monitoring rights. You may
simply omit a Select ID line to grant full monitoring rights for inbound
domains.
Example:
SEL_MON_D,
“0-02 04”
SEL_MON_D,
“1-02 08 10”
The OmniMonitor in the DOMAIN1 computer will be allowed to monitor domains 2 and 4, the one in STATION3 may monitor domains 2, 8 and 10, the one in REPORT_SYS have full rights for domains because is not listed.