 introduced
by Karl Pearson in 1905.
introduced
by Karl Pearson in 1905.By Armando Rodriguez
The laws of quantum mechanics state that motion at the atomic level is inherently random. There is nothing inherently random in the FOREX rate stream; the fundamental law is rather simple. The market is constantly digesting macro-economic news which propels rates up or down. A trend is the market’s response to a known economic event. If the market is not responding to known stimuli, then its behavior falls in the random range. The probability of profiting from a trend related trade is high. The million dollar question is: is one able to profit from the random part of rate motion? Many argue that there are laws within the randomness that may allow profiting by simply analyzing the motion of rates. The present article argues against this notion. Profiting on trades in the average is only tenable when the trade is opened in response to a trend and the trend is stronger than the random part of rate motion. The concept of currency pair temperature is introduced as a measure of randomness. A hot market may burry a trend that may easily show during a cold period.
When there’s something well said, quoting is the best option and so, here’s WIKIPEDIA’s description:
A random walk, sometimes denoted RW, is a mathematical
formalization of a trajectory that consists of taking successive random steps.
The results of random walk analysis have been applied to computer science,
physics, ecology, economics, and a number of other fields as a fundamental model
for random processes in time. For example, the path traced by a molecule as it
travels in a liquid or a gas, the search path of a foraging animal, the price of
a fluctuating stock and the financial status of a gambler can all be modeled as
random walks. The term random walk was first
introduced
by Karl Pearson in 1905.
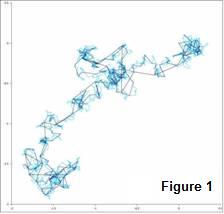
The simplest one dimensional random walk can be described as this “thing” that walks on a track and is equally likely to take a specified sized step forward or backward; say depending on the flip of a coin. This kind of RW, after N steps, renders a normal distribution for the position of the walker. There are other types of RW’s. For instance, what if the steps are not the same size? There are different names for these RW’s, like the drunkard’s walk or the Levy flights that render distributions different than the normal. Figure 1 shows a 2 dimensional random walk
If FOREX rates behaved as an RW, a few important conclusions could be derived. To do this, we are going to query a database with the forex rates (year 2009) to prove that it has the same statistical behavior as an RW. This database holds the rates for the pairs of the most significant world currencies since 2004.
 Allow
an RW to walk N steps repeatedly and the average of the squares of the final
distances to its original position will be proportional to N. This average is
called the variance. Of course if
the number of steps is proportional to time, then the variance will be
proportional to the time the RW has been walking.
Allow
an RW to walk N steps repeatedly and the average of the squares of the final
distances to its original position will be proportional to N. This average is
called the variance. Of course if
the number of steps is proportional to time, then the variance will be
proportional to the time the RW has been walking.
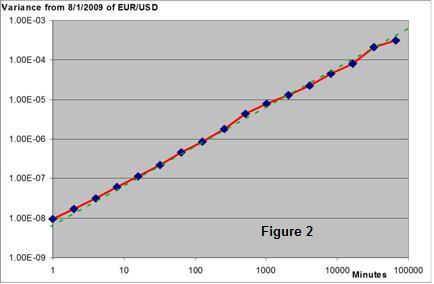
Let us consider a 65536 minutes interval (From August the first to mid September 2009) and take the average of the 65536 minute variances of the EUR/USD quotes; then take the averages of the 32768 two minute variances; then the 16384 four minute variances and so on to the 65536 minute variance. Plotting this data into a chart, we get Figure 2 that shows a clear proportionality between the interval and the variance for about five decades. So far, the FOREX market behaves as a Random Walker.
It wouldn’t be a first that a formulation developed for
phenomena in a particular field is successfully applied in another; it even has
a name and it is called analogy. There are many examples of analogies; the
formulation to solve static mechanicals structures is the same as the one used
to solve electrical networks; news diffuse as a drop of ink in still water, and
so many others. Here we are establishing the analogy of the FOREX market price
changes to the Brownian motion.
Brownian motion (named in honor of the botanist Robert Brown) originally referred to the random motion observed under microscope of pollen floating on water. The observed motion was puzzling because a pollen particle suspended in perfectly still water had no apparent reason to move at all. Einstein pointed out that this motion was caused by the random bombardment of (heat excited) water molecules on the pollen. It was just the result of the molecular nature of matter.
Stock prices change slightly on every transaction, a buy will increase its value and a sell will decrease it. Subject to thousands of buy and sell transactions stock prices should show a one-dimensional Brownian movement. This was the subject of Louis Bachelier PhD thesis in 1900, "The Theory of Speculation". It presented a stochastic analysis of the stock and option markets. Suggesting that FOREX rates may also behave as pollen particles on water is just straight forward.
An interesting property of the Brownian motion is its spectrum. Any periodic function in time can be considered to be the sum of an infinite series of sine/cosine functions of frequencies multiple to the inverse of the period, also known as harmonics, the power of the signal being the sum of the powers of all these sinusoidal components or harmonics. This is called the Fourier series. The concept can be further extended to non periodic functions, actually no useful signal can be perfectly periodic, because then, it could bear no information and so, it wouldn’t be a signal, would it? Real waveforms can only be, at most, approximately periodic during a limited time interval.
 The
concept of the Fourier series can be expanded to non periodical waveforms by
allowing the period to go to infinite.
But if this is allowed, then the frequency interval between Fourier
components becomes infinitely small and so the power of each component. The
power in a finite frequency interval will be a finite value because it will be
the sum of an infinite number of very small components; the Fourier series has
become the Fourier Integral.
Instead of a series of sinusoidal components, each with its power contribution
to the signal, now there is a continuum of power density (power per frequency
interval, like Watts/Hz). To any
waveform there is power density as a function of the frequency, this function is
called the spectrum of this waveform.
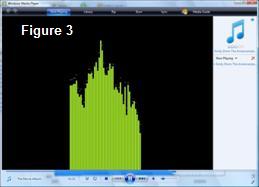
Signal representation in the frequency space is the common language in
information transmission, modulation and noise, but graphic equalizers, included
even in the home audio equipment and PC audio programs, have brought the concept
from the science community to the household. Figure 3 shows a spectrum of the
music being played on the Microsoft’s Windows Media Player©.
The
concept of the Fourier series can be expanded to non periodical waveforms by
allowing the period to go to infinite.
But if this is allowed, then the frequency interval between Fourier
components becomes infinitely small and so the power of each component. The
power in a finite frequency interval will be a finite value because it will be
the sum of an infinite number of very small components; the Fourier series has
become the Fourier Integral.
Instead of a series of sinusoidal components, each with its power contribution
to the signal, now there is a continuum of power density (power per frequency
interval, like Watts/Hz). To any
waveform there is power density as a function of the frequency, this function is
called the spectrum of this waveform.
Signal representation in the frequency space is the common language in
information transmission, modulation and noise, but graphic equalizers, included
even in the home audio equipment and PC audio programs, have brought the concept
from the science community to the household. Figure 3 shows a spectrum of the
music being played on the Microsoft’s Windows Media Player©.
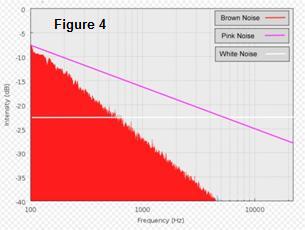
Present in any useful signal, is noise. These are unwanted signals, random in nature, from different physical origins. The spectrum of noise relates to its origin:
 ·
The Johnson–Nyquist noise (thermal noise, Johnson noise,
or Nyquist noise) is the electronic noise generated by the thermal
agitation of the charge carriers (usually the electrons) inside an electrical
conductor at equilibrium, which happens regardless of any applied voltage.
Thermal noise is approximately white, meaning that the power spectral density is
equal throughout the frequency spectrum.
·
The Johnson–Nyquist noise (thermal noise, Johnson noise,
or Nyquist noise) is the electronic noise generated by the thermal
agitation of the charge carriers (usually the electrons) inside an electrical
conductor at equilibrium, which happens regardless of any applied voltage.
Thermal noise is approximately white, meaning that the power spectral density is
equal throughout the frequency spectrum.
· Flicker noise is a type of electronic noise with a 1/f, or pink spectrum. It is therefore often referred to as 1/f noise or pink noise, though these terms have wider definitions. It occurs in almost all electronic devices, and results from a variety of effects, such as impurities in a conductive channel, generation and recombination noise in a transistor due to base current, and so on.
· Finally Brownian noise or red noise is the kind of signal noise produced by Brownian motion. Its spectral density is proportional to 1/f2, meaning it has more power at lower frequencies, even more so than pink noise.
So if the analogy is to hold, the “power” spectrum of the FOREX quotes should follow a 1/f2 law. In a signal, power goes with the square of its voltage amplitude, current amplitude or displacements, whatever the signal is about. So, the square of the amplitudes of the quotes spectrum should go with 1/f2 if its behavior was Brownian.
The process for obtaining a spectrum goes like this:
· The FOREX signal must be sampled at a specified interval of T seconds
· The number of samples N to be taken must be a power of 2, like 256, 512 or 4096.
· A Fast Fourier Transform (FFT) must be applied to those samples
· The spectrum obtained goes from 0 to 1/2T Hz in increments of 1/NT.
·
Each discrete component is squared and divided
into the frequency interval to obtain the power density
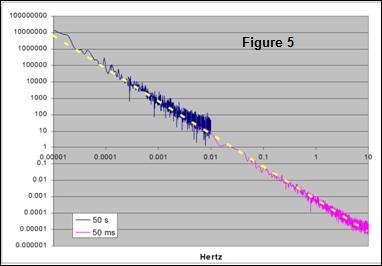
A query was implemented to sample the EUR/USD quotes every 50 ms, starting on the midday of Monday August 3rd of 2009 and took 4096 samples, covering approximately 7 minutes. Next, the same query was run with a sampling interval a thousand times larger, a 50 second interval. EXCEL 2007 data analysis tool, which accepts sets only up to 4096 samples, was used for obtaining the FFT of the mentioned samples sets. Charted results using a log/log scale are shown on Figure 5, where 6 full decades of 1/f2 behavior can be observed; this is from periods of 100 ms to 27 hours.
But wait, there’s more; it is easily proved that a signal with 1/f2 spectrum renders, for any given time interval, an average power that is proportional to the time interval; but power is also proportional to the variance of the signal, so saying that a FOREX data stream has a variance proportional to the time interval and that it has a 1/f2 spectrum, is actually saying the same thing. This also says that something with a Brownian spectrum behaves like a Random Walker. Since variance proportionality to time interval holds from 1 minute to 45 days, as proven above, then we can extend the validity of the Brownian spectrum of the FOREX rates from periods 100 ms to 45 days, almost 8 decades!
There are trade strategies out there, like MACD that are implicitly based on the belief that the FOREX market has some sort of inertia. In other words, that it can hold some “momentum”; that a trend is somehow more likely to hold than to change. Could the FOREX market be so and still show a 1/f2 spectrum?
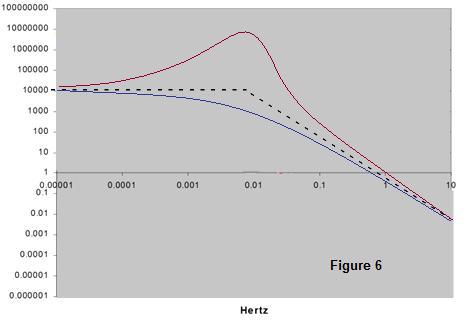 Sticking
to the mechanical analogy, let’s assume the rates as a massive body, connected
by some mechanical means to a white noise force (constant spectrum),
representing the myriad of transactions that drive the market. There is no
mechanical means perfectly rigid, so some elasticity and losses must be
involved. The resulting spectrum for the motion of the mass in a system like
this is called Lorentzian (Figure 6).
For high frequencies, this system actually shows a 1/f2
spectrum, just like the Brownian, but for low frequencies, the mass can follow
the driving force (with an inertial lag), showing its white or constant
spectrum. When going from the low
to the high frequency zones, these systems may show a more or less smooth
transition or even a resonance.
Sticking
to the mechanical analogy, let’s assume the rates as a massive body, connected
by some mechanical means to a white noise force (constant spectrum),
representing the myriad of transactions that drive the market. There is no
mechanical means perfectly rigid, so some elasticity and losses must be
involved. The resulting spectrum for the motion of the mass in a system like
this is called Lorentzian (Figure 6).
For high frequencies, this system actually shows a 1/f2
spectrum, just like the Brownian, but for low frequencies, the mass can follow
the driving force (with an inertial lag), showing its white or constant
spectrum. When going from the low
to the high frequency zones, these systems may show a more or less smooth
transition or even a resonance.
It is the low frequency zone the one that can be associated with an inertial behavior, so a believer in the market inertia may still argue that the transition frequency period may be longer than the 45 day lower limit of the study presented here. This is an impossible argument to beat, since no matter how low in frequency you go, a transition may still exist at a frequency lower than the one you reached.
The problem would then be about the practical value of the concept of market inertia. If such a behavior only showed for periods much longer than 45 days, it is unlikely that it can be useful to a trader that is unlikely to hold a position for that long.
The term martingale originally referred to a set of betting strategies popular in France by the 18th Century. These strategies, though appealing at first, could lead to bankruptcy if actually followed.
The simplest of these strategies is the one in which the gambler doubles his bet after every loss, so that the first win would recover all previous losses plus win a profit equal to the original stake. Sounds great, but the exponential growth of the bets would eventually bankrupt anyone who chooses to gamble by this Martingale.
The modern concept of martingale in probability theory was introduced early in the 20th century by Paul Pierre Lévy, and much of the original development of the theory was done by Joseph Leo Doob among others. The motivation for that work was to show the impossibility of successful betting strategies. This modern concept of martingale applies, not to strategies, but to Stochastic Processes. In other words, these Stochastic Processes are sequences of a random variable, in which systematic winning is impossible, no matter what strategy is followed. One of the many theorems proved for the RW is that it generates a martingale sequence.
One very appealing trade strategies in the FOREX market is that of setting a target profit smaller than the loss limit. The argument is that winning little is a lot more likely than losing big. This last assertion is true, but here’s this RW theorem: it says that the probability of reaching point b, without hitting first point –a is a/(a+b). So assume that b is the profit target and a, the loss limit, then the winnings in the average will be:
W = b x (a/(a+b)) = ab/(a+b)
The average losses:
L = a x (1 - a/(a+b)) = ab/(a+b)
The overall winnings T, even in the absence of spreads and fees, would be W – L = 0
|
Pair |
cntA |
cntB |
Last Date |
|
EUR/USD |
102 |
1000 |
2009-08-07 12:58:19.947 |
|
GBP/USD |
95 |
1000 |
2009-06-05 05:02:47.793 |
|
AUS/USD |
44 |
500 |
2009-06-16 08:33:15.160 |
|
USD/CAD |
127 |
1000 |
2009-09-17 11:58:45.777 |
|
USD/CHF |
60 |
500 |
2009-06-24 11:28:21.263 |
|
Total |
856 |
8000 |
|
So again, if the FOREX rates followed an RW, this strategy would render no profit. A query was devised for testing this directly. Starting from a specified date, the query checks the quotes of a specified pair for being over a given upper limit b pips above the present quote or under an, also given, lower limit a pips below. If the quotes go beyond any of the limits, it increments the corresponding count and repeats the process. The query stops at a specified number of wins (b hits), the results for a = 100 and b = 10 and starting by 3/3/2009 are shown in Table 1. The probability for hitting b, as from the RW theorem, would be 10/(10+100) = 0.909; measured frequency ratios were 8000/(856+8000) = 0.9033. Though this only disproves one of the many proposed strategies, it is the author’s opinion that the answer to the question is a YES, FOREX sequences are martingales.
Figure 2 may deceive the reader into believing that a 1 minute interval always renders a 10 -8 variance, but that is not true at all. Had a different starting date than 8/1/2009 been chosen, the straight line in Figure 2 , though remaining parallel to it, could had move up or down. But even with the same starting date, that 10 -8 is not the minute variance for midnight of 8/1/2009, but an average over all the 65536 one minute intervals. The actual individual minute variances surely dispersed a lot. For instance, Figure 7 shows how the hourly variances move during a week.
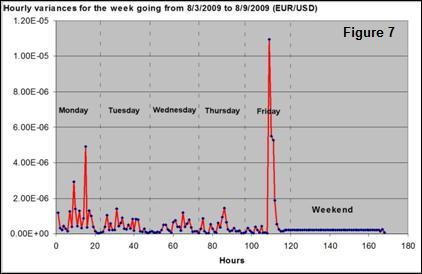 Besides
being far from constant, a pattern may also be easily noticed. Variances are
small around midnight and peak sometime during the day, especially on Friday.
Besides
being far from constant, a pattern may also be easily noticed. Variances are
small around midnight and peak sometime during the day, especially on Friday.
In the Brownian motion, observed variances in any given time interval are proportional to the temperature of the liquid that suspends them. Following the analogy, the variance of the FOREX quotes may be related to some “market temperature” for a given pair. Then we can say that the market cools by night and warms up by day or that the market if hot today for, say the USD/JPY.
This
is as far as the analogy goes because there is a basic difference between a
physical Brownian system and a FOREX market pair. In the first, the internal
energy of the system is conserved, meaning that for cooling or heating it,
energy must be drained from or supplied to the system and this involves time. On
the other hand, quotes energy may disappear or appear without any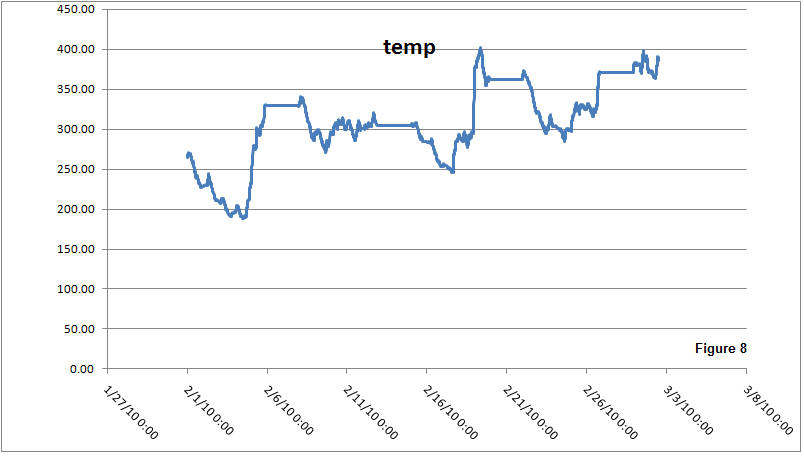 draining/supplying being involved, this because the market has no such thing as
inertia. For making a market temperature behave as a Brownian system the
stability must be artificially built in by using a running average instead of a
sequence of values
draining/supplying being involved, this because the market has no such thing as
inertia. For making a market temperature behave as a Brownian system the
stability must be artificially built in by using a running average instead of a
sequence of values
To speak in temperature terms, variances may be stretched into a familiar scale, for instance one that compares to room temperatures in Fahrenheit. One possible definition would be that of setting, say the 2009 average variance to 77° F. An alternative scale, more familiar to the Europeans, would be a Celsius scale in which the average would be set to 25°C. An example of temperature history for EUR/USD is shown in Figure 8 using an absolute Kelvin scale.
Summarizing:
· Louis Bachelier suggested that the stock market rates behaved like a random walker in is PhD thesis, so why shouldn’t it be the same for the FOREX market?
· A statistical test proved that variance and the spectrum of the FOREX market were consistent with the random walker behavior in periods ranging from 100 ms to 45 days.
· Market inertia was shown to be inconsistent with the observed FOREX spectrum, leaving no reason to believe in trading strategies based on such an assumption (i.e., MACD).
· Early in the 20th century, Paul Pierre Lévy and Joseph Leo Doob, among others, proved that there could be no possible winning strategy in any fair (perfectly random) game, using the term Martingales to classify such stochastic sequences. A random walk generates a martingale, so having proved that FOREX rates behave as such, then they must also be martingales.
· Another statistical test on the rates during a six month period within 2009 showed that FOREX rates complied with one of the basic random walker theorems, directly disproving the commonly proposed strategy based on the notion that profiting little is way more likely than losing big.
Based on the above, it is this author’s opinion that hot is bad. Being the FOREX sequences martingales, no trading strategy will render average profits in a long run. A trader can only profit after a timely identification of a trend. A trend can be forecasted if a cause that leads to a market change is known before the transition is over, but at the same time, there can be a myriad of other causes, unknown to the trader, that can add up to cancel the effect of the said known cause. The effect of the unknown causes is perceived by the trader as random motion of the quotes and randomness could hide a trend. So for this hypothetical trader, a hot market is bad for profiting on a trend.
However, traders that believe in Technical Analysis may not agree to the above. They believe that there may still be hidden laws driving the quote sequences and if that was true, then the hotter the market the greater the potential profits. Yet …Technical Analysis has believers, but no billionaires.