This was the answer to a very disappointed client about the performance a low noise amplifier (LNA). This LNA was part of a radiometer explained in "A Radiometer Operation Principle". In the basic papers about the radiometer operating principle, the quality criterion used for such a radiometer was the NEDT or Noise Equivalent Delta Temperature, which is the quotient of the noise voltage RMS (Root Mean Square) to voltage change due to an temperature change in the target at the microwave detector. In every continuous spectrum the RMS is a strong function of frequency band being considered, the mentioned basic papers were referring to the background noise RMS in the microwave W band at room temperature, while the voltage due to temperature changes was estimated using the blackbody radiation functions. This client was trying to measure NEDT by sampling the output voltage of the microwave detector. There's no problem with measuring the voltage shift due to a temperature change, the discussion below refers to the noise RMS calculation.
The RMS of a waveform can be estimated by calculating the standard deviation of a number of samples. As long as the sample rate is twice as great as the its highest significant spectral component and the number of samples covers a period greater than that of its lowest, this calculation will render the right answer. However, when dealing with noise or any other wide band signal, the RMS always becomes a function of the sample size.
The noise RMS :
VRMS = √ (R* PBand)
Where PBand is the total noise power in the band being measured and R is load resistance.
⌠fhi
PBand = │P(f)df
⌡flow
P(f) being the spectral power density.
With a sampled signal, the higher end of the band is equal to half the sample rate, while the lower end is:
flow = (Sample rate)/(Sample Size)
This means that PBand increases with the sample size if the sample rate is held constant. The Vrms increases with the square root of this power. In the case of noise with a (1/f)n spectrum, this dependency gets stronger because the spot power increases as the frequency approaches zero.
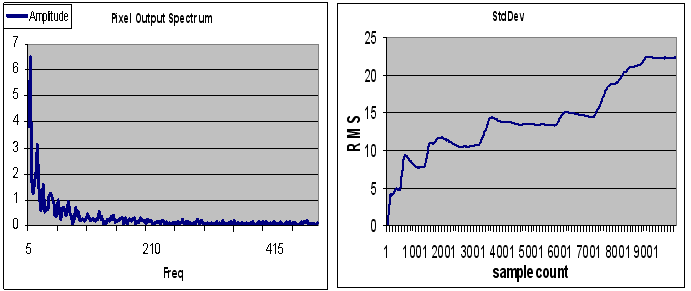
Below is the spectrum of pixel output signal and beside the standard deviations as a function of the sample count.
So, in order to have a useful figure for performance comparison, you must fix the sample count to a value that somehow relates to the radiometer operation times, for instance, the frame period. Still, the values obtained for NEDT using this approach won't necessarily correspond to the reported values in the origiunal reference papers on the radiometer principle; in those, the noise RMS refer to the microwave W band.
/********************************************************************************************************/
What seemed to be a promising performance improvement would have resulted in a futile effort
Pixels are reported to show a 1/f noise. For low frequencies this noise shows as a slow drift of the LNA output. The actual signal will be sitting on top of the background temperature and this drifting output. Though the signal might always show on top of this moving background, each pixel will drift differently showing on the thermal image as columns with different luminance, resulting in a nasty artifact.
If with at a frequency frec, the pixels are exposed to an isothermal object, then that output can be used as an offset to be subtracted to the readings thereon. In other words, the new subtracted output would be proportional to the temperature difference from the isothermal object. Of course, there may be a drift from one calibration to next, but an improvement is to be expected since the noise below frec can then be considered not contribute.
The pixel noise power P can be expressed as:
⌠fhi
P = P0 │1/f df = P0 ln(fhi/frec)
⌡frec
Where fhi is the band’s high frequency limit, which is 150 Hz for the 16 pixel radiometer.
The output noise RMS voltage must have the form:
V = V0 √ ln(fhi/frec)
The drift must be proportional to V that increases when the recalibration frequency is lowered. How much improvement is to be expected by incrementing the recalibration frequency? say we go from frec = 0.0011Hz (once ever 15 minutes) to frec = 10Hz (ten times per second) is:
V10/V0.0011 = √ ln(15)/ln(135000) = 0.48
The recalibration frequency changed 4 orders of magnitude, but the drift just halved!