
Go to Section 2.1. : Section 2.3 Contents
Internet connections can occasionally drop and the system will automatically reconnect after a timeout, but during this process it could lose some packets, thus some of the graphic info being displayed may not be totally up to date. Calls that finished while the connection was down may still show as connected or as connecting. I you become suspicious of your info not being current, you may hit Refresh Info and the relay close the current connection, open a new one and resend all the current info.
It is similar to the above in the sense that it has to do with resetting TCP connections, this time it is about the TCP connection between the Gateway and the GW_Relay. You need to use this if the version on the gateway is changed, or settings are changed that could require reading again some gateway data. For instance, if you change the name of the gateway, the TELNET prompt will change and the GW_Relay will immediately get "stuck", after a timeout it will reset on its own, but if you don't want to wait, hit ReQuery.
This Window allows to watch simultaneously the information to all the calls in a span in the same format as in the Call Info Text-Box
You can scroll through the spans, as soon as you click on the scroll button a span indicator in a yellow background will show on the top-left of the window. You may also use page-up/down to scroll through the spans.
Any debug information is sent to this window. What exactly?
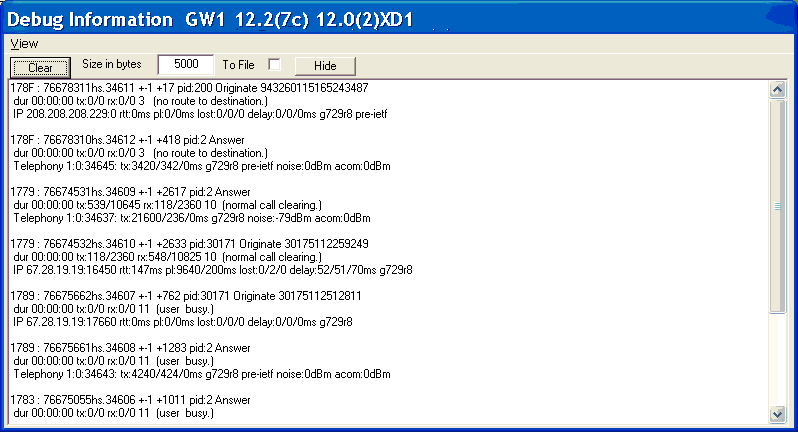
If you check To File, a file dialog window will open so you can select a path and enter a name for the file. After that all the displayed information is also saved to that files. Hitting Hide does not close the file, when you are ready to close, uncheck. Clear will just clear the screen, not the file.
Under View, you will find a choice for the debug message delimiter, by default it is New Line, but when messages a short and numerous, you may want to keep as much of them in view as possible, in that case chose Tabs.
Even when CDR collection is not enabled, call information is still gathered to calculate summary values, meaning averages and totals for each and every half hour in a day. A file called SummFile.Log .is constantly updated with this information, when you reload the GW_Relay.exe, the information in this file is read to continue the process where it was left.
The variables summarized are:
When you hit this item, the following window opens:

The combo box drop down list shows all the IP adrresses and DS0 group numbers that has been referenced by a call since GW_Relay started. It may not include all the possible ones, but. A recently restarted GW_Relay, may show an incomplete list. Select the select the IP or DS0 group to be graphed and hit OK. An testbox is the same as Cancel. This window opens in Modal style, meaning that it stops the app main thread, so packets from the GW_Relay are not being processed while opened. If you don't close this window in a reasonable time, the buffer might overflow and some alarm and debug information can be lost, channels status info can always be recovered by hitting menu item Refresh Info.
Hitting the OK will send a "g<reference>" command to the GW_Relay, it will reply with the summary data. The information will be displayed in graphic from as shown below:

Please notice the missing segment in the first three graphs, the one between 2 and 3 AM, is missing because the were no calls in those two half hours, averages have no meaning if there is not, at least, one element. A second missing segment correspond to the current half hour when the graph was requested, summary values become available only at the end of each half hour.
Completion rates reported in this graph are affected by the minimum call length definition for the Watchdog. If the GW_Relay.ini file parameter WD_SHORT_CALL_DEF is present and different than zero, calls shorter than the specified value are considered as bad.
The Scale has been adjusted according to the maximum values encountered. Scales grow in oscilloscope style: 1, 2,3 and 5 for each power of ten (.1,.2,.3,.5.1,2,3,5,10,20,30,50,...)
Opens a file dialogue for you to browse and find a saved summary to open in a window different to the ones that could be already opened.

Will open a file dialogue so you can chose the path and file name to save the summary info with. By default the file name will be:
"Peer <number> on <Date>.gph
Will open a file dialogue so you can browse your drive to find saved graphs. Once found, the graph will be drawn on the same scale as the original one on it. Is shows like this:

Each comparative curve added will show with a different thinner line style, continuous; dashes; dots; dash dot and dash dot dot dash. Up to five graphs may be added for comparing.
Simple uses the same window to load a new graph.
Basically does the same as the menu item in 2.2.5.2, it opens a file dialogue for you to browse and find a saved summary to open in a window different to the ones that could be already opened.
This window supports the feature that allows broadcasting messages to the rest of the monitors currently connected.
Go to Section 2.1. : Section 2.3 Contents